Project 5.1
WealthC Analysis
For the first set of tests I set WealthC as the target and the rest of the dataset (excluding WealthC and WealthI) as the features. I removed the NaN data, which only constituted 83 out of over 47,000 values so doing so didn’t introduce a big risk of biasing the dataset.
The first test I ran was a linear regression, which yielded training and testing R squared values of 0.7358365784782854 and 0.7350536560539934 respectively. The mean squared error was 0.4437568673467586 for the testing data and 0.4427858616687968 for the training data. Next, I standardized teh results using StandardScaler by changing the standardize argument in the KFold function to True, which produced very similar results. Standardizing the data yielded a training R squared of 0.7358196018893879 and a testing R squared of 0.7350372348316933. These values are actually slightly lower than the non-standardized ones but only if they’re compared out to the 5th decimal place and beyond, so there isn’t functionally a large difference between them. The MSE for the standardized data was also very similar. The training MSE was 0.44281428271086326 and the testing MSE was 0.4437849039355669 and these values are extremely close to the non-standardized MSE values.
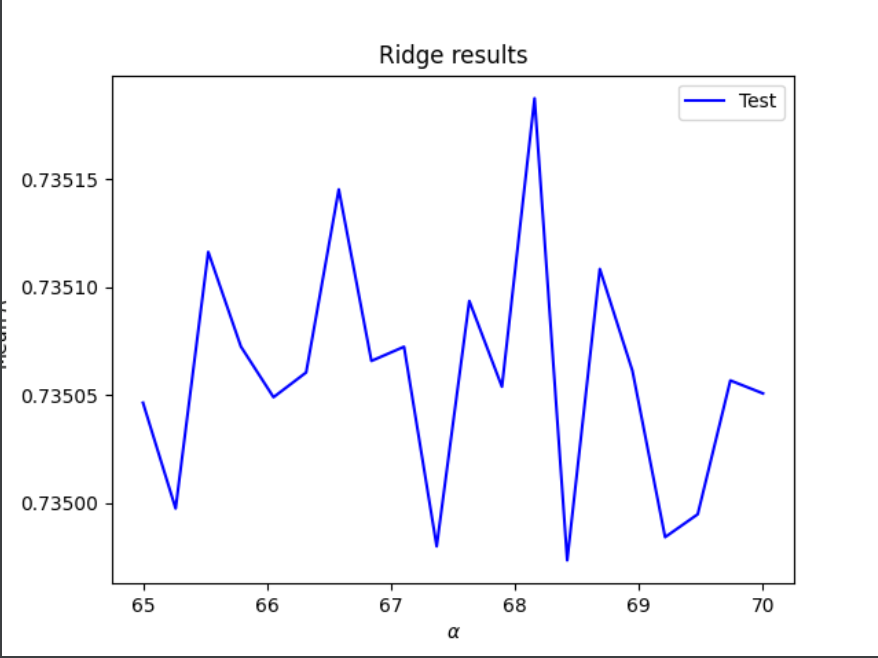
Next I ran a ridge and lasso regression on this data. I ran into a problem with my ridge regression that caused it to set the optimal alpha as whatever the highest value in the alpha range was and after graphing the alpha range against R sqaured, it appeared that the corresponding R sqaured value was the same (or very close) for every value of alph abetween 20 and 120. This problem seemed to be caused by a problem with the KFold function. After the KFold was fixed I ran it again using a range of 65 to 70 and I got an optimal alpha level of 68.15789473684211, a training R sqaured of 0.7358357835197123, and a testing R sqaured of 0.7351780962057564. This shows a slight immprovement from the linear regression but only at the 4th decimal place.
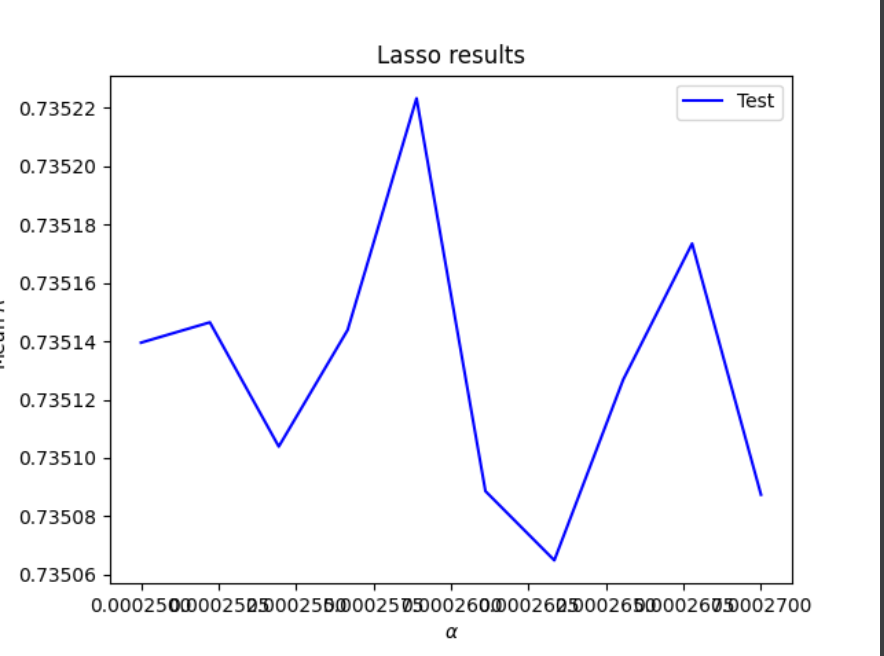
For the lasso regression I started with an alpha range of 0.0001 to 0.0003 and ended up narrowing this down to a range from 0.00025 to 0.00028 after a few tests. This yielded an optimal alpha of 0.0002588888888888889 and training and testing R squared values of 0.7358346356402806 and 0.7350562589633233 respectively. These values are extremely close to the ridge regression R squared values.
WealthI Analysis
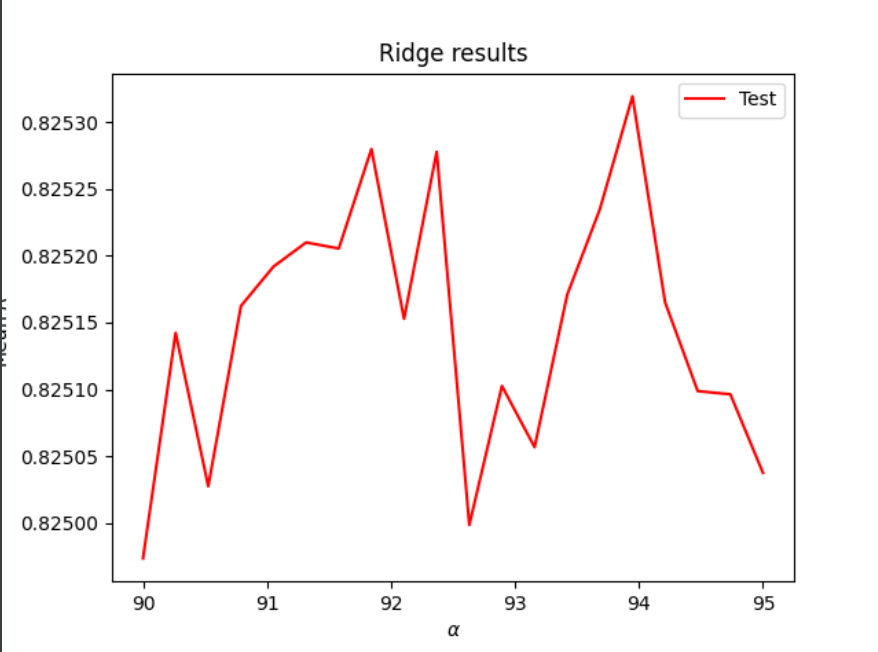
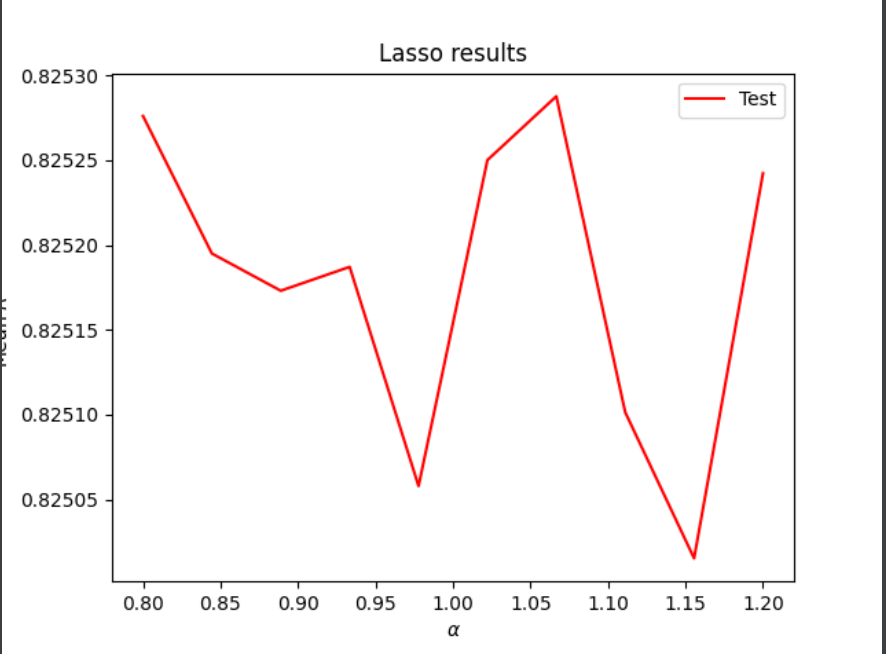
Next I repeated all of the previous steps with WealthI as the target instead of WealthC. I got much better R squared values (about 0.82) for these tests but I also found the MSE was huge (in the billions) so I’m not sure what went wrong with that measure. The process was pretty much the same as before so I’m not going into as much depth but the results for each test are reported below. For the ridge regression I ended up using a range of 90 to 95 and for the lasso regression I used a range of 0.8 to 1.2. The lasso regression raised a convergence error as it did for the WealthC trial and it took about 10 minutes to run but it eventually yielded the values listed below.
Linear regression (unstandardized)
Training R squared: 0.8258367088313527
Testing R squared: 0.8252111517825776
Linear regression (standardized)
Training R squared: 0.8258291258594239
Testing R squared: 0.8250045466344688
Ridge Regression
Training R squared: 0.8258366827575075
Testing R squared: 0.8250203620492174
optimal alpha: 93.94736842105263
Lasso regression
Training R squared: 0.8258372542786979
Testing R squared: 0.82501982545465
optimal alpha: 1.0666666666666667
As before, the values are very similar to one another but the lasso and ridge regressions are slightly better than the linear regression.
Comparison
Overall, the R squared values for WealthI were much higher than those for WealthC for all 3 tests, which indicates that this varaible is more highly correlated with the rest of the variables in this dataset. Even the best alphas for the ridge and lasso regressions produced lower R squared values when WealthC was the target, as shown in the graphs below. The y axis got cut off a little bit but these graphs all show alpha level on the x axis and mean R squared on the y axis.
Ridge Regression (WealthC shown in blue, WealthI shown in red)


Lasso Regression (WealthC shown in blue, WealthI shown in red)


The best results for the testing data came from the ridge regression for WealthI, but this was extremely close to the lasso regression for WealthI. The ridge regression also yielded the best results for the WealthC data, so it seems like this is the best type of regression for these two wealth variables in this dataset.