Project 5.2
Qeustion 1
First I imported the city persons CSV file, removed NaN values, and changed education and age to integers. Next I set X to everything except WealthC and y equal to WealthC.
For the K nearest neighbors test I used a narrowed in on a range from 70 to 80 for k. From this range the best value of k was 72, which yielded a testing score of 0.5622254758418741, which was very close to the training score and indicates the model was not overfit. I then ran the same analysis after adding weights = distance, which returned a best k value of 73 and a testing score of 0.5012201073694486. This is slightly lower than the unweighted testing score but fairly similar.
Question 2
Next I implemented a logistic regression using WealthC as the target to see how this compared to the KNN output. The logistic regression yielded a training score of 0.548828125 and a testing score of 0.5436798438262567. These scores are slightly lower than the unweighted KNN model but the training and testing scores are very close which again indicated the model is not overfit.
Question 3
Next I used a random forest with 100, 500, 1000, and 5000 estimators using both the raw and scaled data.
Raw data training and testing values:
100 trees: [0.7890625, 0.5012201073694486]
500 trees: [0.7890625, 0.509028794533919]
1000 trees: [0.7890625, 0.49829184968277207]
5000 trees: [0.7890625, 0.5046364080039043]
Scaled data training and testing values:
100 trees: [0.7981770833333334, 0.4992679355783309]
500 trees: [0.7981770833333334, 0.5031722791605662]
1000 trees: [0.7981770833333334, 0.5065885797950219]
5000 trees: [0.7981770833333334, 0.5080527086383602]
The scaled data produced slightly higher training and testing results, with the 5000 tree run producing the highest scores.
I also found that the minimum number of splits for the random forest was 28.
Question 4
I then repeated all of the previous tests with 2 and 3 as a single outcome (all 3s were turned into 4s).
Without weights the best k was 75 and this produced testing and training scores of 0.6144460712542704 and 0.6279296875, respectively. After weighting distance the best k was 79, which yielded testing and training scores of 0.5895558809175208 and 0.8326822916666666.
The logistic regression model produced training and testing scores of 0.6002604166666666 and 0.6120058565153733, which is better than the weighted KNN but worse than the unweighted KNN.
The raw decision tree results are shown below [train,test]:
100 trees: [0.8333333333333334, 0.5846754514397267]
500 trees: [0.8333333333333334, 0.5710102489019033]
1000 trees: [0.8333333333333334, 0.5714982918496828]
5000 trees: [0.8333333333333334, 0.5758906783796974]
Standardized tree results:
100 trees: [0.8333333333333334, 0.5871156661786238]
500 trees: [0.8333333333333334, 0.5812591508052709]
1000 trees: [0.8333333333333334, 0.582723279648609]
5000 trees: [0.8333333333333334, 0.5856515373352855]
These testing scores are actually a big improvement from the first decision tree model. Overall the merging of classes 2 and 3 improved the model which could be due to decreased variance among the wealth classes that resulted in better predictive power of the model.
Results
The logistic regression produced the best results in both cases of merged and unmerged data. The merging of classes 2 and 3 improved the model to produce a testing score of about 0.6, which indicates a moderate relationship between these variables.
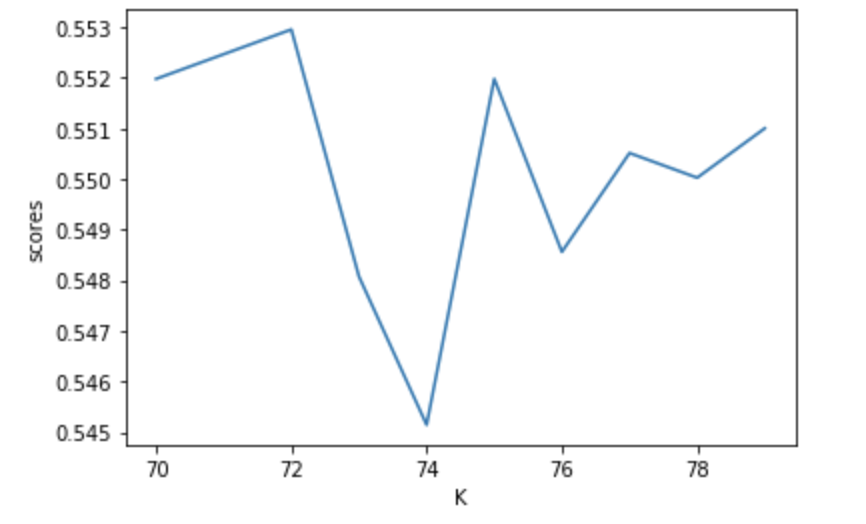
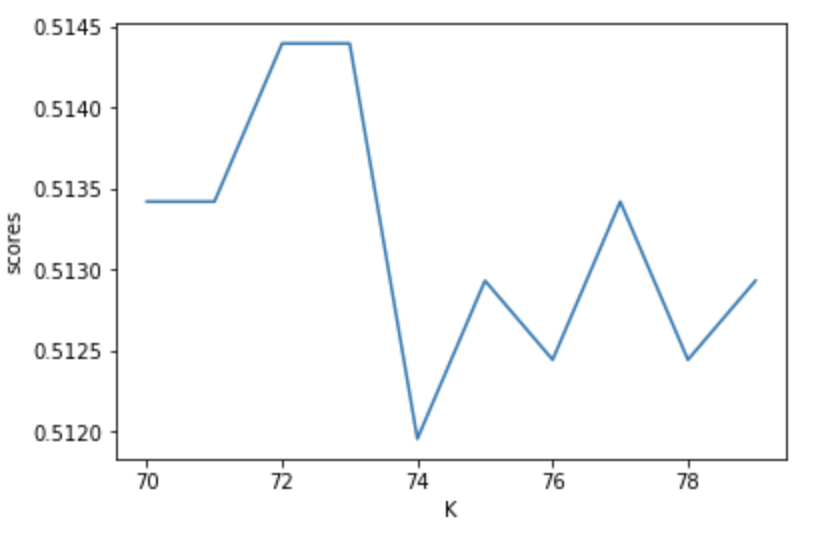
Before merging 2 and 3
Unstandardized K value vs testing score for KNN

Standardized K value vs testing score for KNN

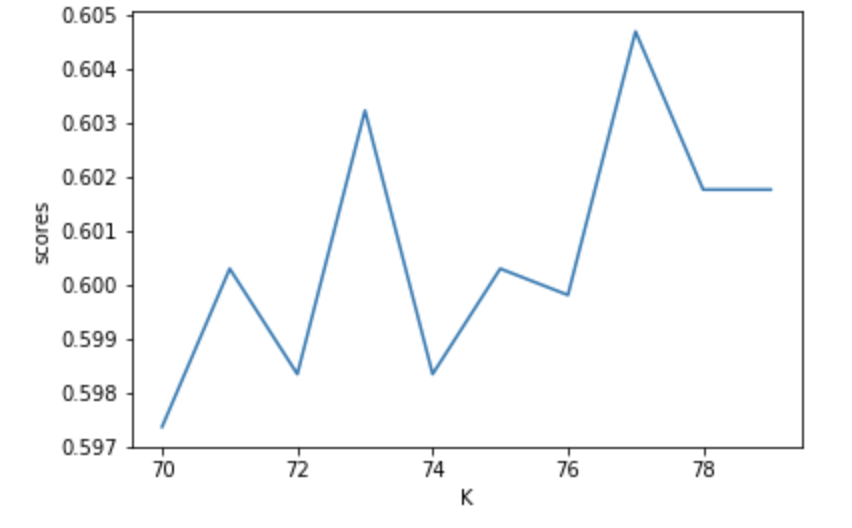
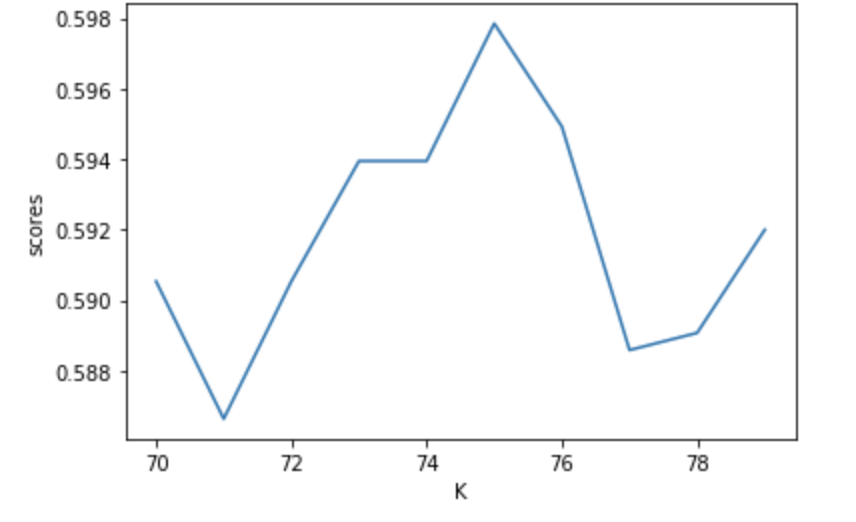
After merging 2 and 3
Unstandardized K value vs testing score for KNN

Standardized K value vs testing score for KNN
